
The term comes from Ward Cunningham, who used it in 1992 to explain why shipping early and improving later can be a sensible choice, as long as the team goes back and repays. The problem starts when nobody does. Releases slow down, small changes break unrelated features, alerts stop meaning anything and new developers need months to become productive.
Technical debt becomes manageable when a team measures its interest, meaning the extra time and failures it causes on each change, and pays down first the debt that touches the most frequently changed and most valuable parts of the product.
This article gives a working definition, explains the technical debt quadrants, sets out a ten-metric scorecard with thresholds and shows how to decide what to pay down using real before-and-after results. It does not cover replacing an entire legacy system, and it does not review static analysis tools.
Key takeaways
- Technical debt has a principal, the work needed to fix it, and interest, the extra effort and incidents it causes on every change.
- Martin Fowler's quadrants sort debt by two questions: was it deliberate or inadvertent, and was it prudent or reckless?
- Debt can be measured with ordinary delivery data: change fail rate, deployment frequency, lead time, test coverage on critical paths, alert noise, dependency age and the share of time spent on unplanned work.
- Pay down debt where interest is high and principal is low first. Debt in code nobody changes can often wait.
- A steady allocation of 15–20% of team capacity works better than large cleanup projects.
- AI-generated code adds debt quickly when it is merged without review, tests or a shared structure.
The technical debt quadrants
Martin Fowler's technical debt quadrant, published in 2009, sorts debt along two axes: whether the team took it on deliberately or without realizing, and whether the decision was prudent or reckless.
| Reckless | Prudent | |
|---|---|---|
| Deliberate | The team knows better practices and skips design to save time | The team knows the cost and accepts it for a clear benefit, such as an earlier release |
| Inadvertent | The team does not know good practices and creates debt without noticing | The team learns a better design only after building the first version |
The quadrants matter for one practical reason: each one needs a different response. Prudent deliberate debt needs a ticket and a repayment date at the moment it is taken on. Reckless deliberate debt needs a change in how deadlines are negotiated. Reckless inadvertent debt needs code review, mentoring or more experienced engineers. Prudent inadvertent debt is normal, and the response is refactoring as the team learns.
Where technical debt lives
| Type | What it looks like | Typical interest |
|---|---|---|
| Code | Duplicated logic, long functions, unclear names | Slow changes, bugs fixed in one place and not another |
| Architecture | Tight coupling between modules, a shared database used by everything | Small features require changes across the system |
| Tests | Few or no automated tests on critical flows | Every release needs manual checking, and regressions reach users |
| Dependencies | Frameworks and libraries several major versions behind, or past end of life | Security exposure and painful upgrades that grow with each skipped version |
| Infrastructure | Manual deployments, configuration that exists only on servers | Risky releases and slow recovery after incidents |
| Observability | Noisy alerts, missing logs, no metrics on key flows | Problems found by customers before the team |
| Documentation | Knowledge held by one or two people | Slow onboarding and risk when people leave |
| Data | Inconsistent formats, duplicate records, no single source | Wrong reports and fragile integrations |
A technical debt scorecard
The metrics below can be collected from tools most teams already use: the code host, the CI pipeline, the issue tracker and the monitoring system. Four of them come from the DORA software delivery metrics, which research has linked to delivery performance. The thresholds are practical guidance for product teams, not industry standards.
| Metric | How to measure | Healthy | Warning | Debt problem |
|---|---|---|---|---|
| Change fail rate | Share of deployments that need a rollback or hotfix | Under 10% | 10–20% | Over 20% |
| Deployment frequency | How often the team releases to production | Daily or weekly | Every 2–4 weeks | Monthly or less |
| Change lead time | Time between commit and production release | Under a week | 1–4 weeks | Over a month |
| Failed deployment recovery time | Time to recover from a failed release | Under an hour | Hours | Days |
| Test coverage on critical flows | Share of revenue and data-sensitive flows covered by automated tests | All of them | Most of them | Few or none |
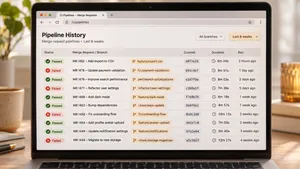
| Actionable alerts | Share of alerts that lead to an action | Over 80% | 40–80% | Under 40% |
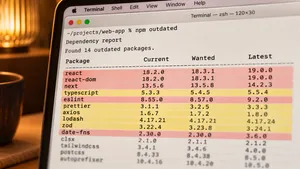
| Dependency age | Major versions behind on the main framework and runtime | Current or one behind | Two behind | Past end of life |
| Unplanned work | Share of sprint time spent on bugs and incidents | Under 15% | 15–30% | Over 30% |
| Estimate drift | Actual effort compared with estimate for small changes | Within 1.5 times | 1.5–3 times | Over 3 times |
| Onboarding time | Time until a new developer ships a meaningful change | Under 2 weeks | 2–6 weeks | Over 6 weeks |
Score each metric as 0 for healthy, 1 for warning and 2 for a debt problem. A total of 0–5 means the debt is under control. A total of 6–12 means it is slowing the team and needs a regular allocation. A total above 12 usually means debt has become the main constraint on the roadmap, and a focused stabilization phase will pay back faster than new features.
How to decide what to pay down
Estimate the interest
For each debt item, estimate the interest as extra hours per change × changes per month × hourly cost, plus the cost of incidents it causes.
A worked example: a pricing module without tests needs about six extra hours of manual checking for every change and is changed eight times a month. At $60 an hour, that is $2,880 a month in interest, before counting the two production incidents it caused last quarter. Adding tests and splitting the module is estimated at 80 hours, or $4,800. The repayment pays for itself in under two months.
Sort by interest and principal
| Low principal (quick to fix) | High principal (large effort) | |
|---|---|---|
| High interest (frequently changed, causes incidents) | Fix now, in the current sprint | Plan as a project with milestones |
| Low interest (rarely changed, stable) | Fix opportunistically when touching the code | Leave it, and record the decision |
Code that nobody changes costs little interest, however untidy it looks. The most expensive debt sits in the parts of the product that change every week, which is why change frequency from the code history is one of the most useful inputs.
Fund it steadily
McKinsey's survey of 50 CIOs found that companies divert 10–20% of their budget for new products to resolving technical debt, and that CIOs estimated debt at 20–40% of the value of their technology estate. Most teams already pay this cost unintentionally. Making it explicit, with 15–20% of each sprint reserved for debt work, turns it into planned work with results the team can report.
Product slowing down and nobody can say exactly why? We measure the debt in your codebase, rank it by cost and pay it down alongside your roadmap.
Explore IT outsourcingPaying down debt: results from our work
| Project | Debt | What was done | Result |
|---|---|---|---|
| B2B supply chain platform | No automated tests, stale Angular dependencies, 50–60 alerts a day | Test suites on every merge request, dependency upgrade, alert rules rebuilt | 5–6 actionable alerts a day, safe upgrade path, audit trail for conflicting edits |
| Healthcare platform | Legacy Drupal 6 core that blocked security and features | Core services moved to Symfony microservices step by step, legacy limited to admin functions | Releases every 2–3 weeks where they once took months, API about 5 times faster, no unplanned downtime after the infrastructure upgrade |
| Food media site with 30–50 million monthly page views | Custom hosting and caching that could not keep up | Managed Drupal hosting, multi-layer caching, dedicated image server | Share of HTML responses under 0.5 seconds rose to 80%, and the team needed only 2–3 developers |
Tests and alerts first
The supply chain platform, which brokers use to track factory and supplier relationships, had no automated tests, stale dependencies and edits that silently overwrote each other. A .wrk team first added Vitest and PHPUnit suites to the GitLab pipeline so every merge request is checked, then cleaned up the Grafana alert rules. About 50–60 daily alerts became 5–6 that each need action. With tests in place, the Angular upgrade could go ahead safely. Read the platform modernization case study.
Paying down architecture debt in stages
A Canadian healthcare startup ran on Drupal 6, which could not meet the security demands of its insurance partners. .wrk extracted core services into Symfony microservices step by step and restricted the legacy system to admin functions. The release cycle shortened to two or three weeks, API calls became about five times faster and monthly outages stopped. Read the healthcare platform case study.
Infrastructure debt at scale
The Daily Meal, a US food site with 30–50 million monthly page views, 1.7 million recipes and 250 GB of images, ran on customized hosting that struggled with speed and uptime. .wrk moved it to managed Drupal hosting, rebuilt caching at the application and CDN levels and moved images to a dedicated server. The share of HTML responses delivered in 0.5 seconds or less rose to 80%, up from 50%, and the release process needed only two or three developers. Read The Daily Meal case study.
Vibe coding and technical debt
AI coding tools produce working code quickly, and they also produce debt quickly when their output is merged without review. The typical pattern is familiar: the same logic generated slightly differently in several places, permission checks placed only in the interface, no tests, and dependencies added for every small task. Each piece works, and the whole becomes harder to change.
The controls are the same ones that limit any debt, applied more strictly:
- Review every AI-generated change like code from a new team member, with attention to duplication and security.
- Require tests with the code, not afterwards.
- Keep shared structure. Project rules, examples and agreed patterns given to the AI tool reduce variation between generated pieces.
- Watch duplication and dependency counts in the scorecard, since they rise first.
Our guide to software project rescue covers what to do when an AI-built application has already accumulated serious debt.
When paying down is no longer enough
Some systems carry so much debt that incremental repayment becomes costlier than replacing parts of them. McKinsey suggests considering a rebuild where debt exceeds about half of an asset's value. In practice, signals include an unsupported core framework, a data model that no longer fits the business and a scorecard total that stays high despite a year of steady repayment. Our article on legacy system modernization explains how to choose between refactoring, replatforming and rebuilding.
Frequently asked questions
What is the definition of technical debt?
Technical debt is the extra effort a team spends on future changes because of shortcuts, outdated components or design choices that no longer fit. Like financial debt, it has a principal, the work to fix it, and interest, the ongoing cost of not fixing it.
What are the technical debt quadrants?
The technical debt quadrants, described by Martin Fowler, classify debt as deliberate or inadvertent and as prudent or reckless. The four combinations help a team understand why debt was created and how to prevent or repay it.
How do you measure technical debt?
Track delivery and quality metrics that debt affects: change fail rate, deployment frequency, lead time, recovery time, test coverage on critical flows, alert noise, dependency age, unplanned work, estimate drift and onboarding time. Then estimate the interest of specific debt items in hours per change.
How much time should a team spend on technical debt?
Many teams reserve 15–20% of each sprint for debt work. Teams with a high scorecard total may need a focused stabilization phase first, before returning to a steady allocation.
What is the difference between technical debt and technology debt?
The terms are often used interchangeably. Technical debt usually refers to code, tests and architecture inside a product, while technology debt is sometimes used more broadly for outdated infrastructure, platforms and systems across a company.
To sum up
Technical debt is the interest a team pays on every change because of past shortcuts and outdated components. Measure it with delivery metrics the team already has, estimate the interest of individual items, pay down the expensive debt in frequently changed code first and fund the work with a steady share of each sprint.
.wrk helps product companies in the US and Europe measure and pay down technical debt, with test coverage, dependency upgrades, alert cleanup and staged architecture changes delivered alongside the product roadmap.
Want to know what your technical debt is costing you? We audit your codebase and delivery data and give you a ranked repayment plan with estimates.
Explore IT outsourcing