
Most systems work well in a demo with ten users and fail under a launch, a seasonal peak or a bot attack, often in places nobody expected: a query that was fine with 50 users, a cache that empties at the wrong moment or a third-party rate limit. A load test finds those limits on a schedule you choose instead of during an outage.
A useful load test models real traffic, measures response times as percentiles instead of averages, sets pass and fail thresholds in advance and runs against an environment that matches production, because a test that skips any of these produces numbers that do not predict what users will experience.
This article explains the types of load tests, how to set targets using traffic data, how to run a test, which metrics and tools matter and what real fixes looked like. It does not cover front-end page speed audits or network penetration testing.
Key takeaways
- Load testing measures how a system behaves as traffic grows. Stress, spike, soak and breakpoint tests push it in different ways.
- Build test targets from real data: peak requests per second, the mix of user journeys and expected growth.
- Little's Law links the numbers: concurrent requests equal requests per second multiplied by response time in seconds.
- Judge results by the 95th and 99th percentile response times and the error rate, not by averages.
- Test against an environment that matches production in data volume, configuration and caching, or the results will flatter the system.
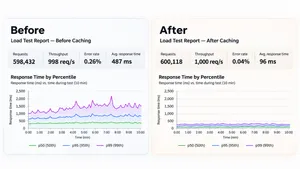
- In a delivered project, caching shared page fragments made a multi-site legal CMS about three times faster under load tests run with wrk and oha.
Types of load tests
The Grafana k6 documentation describes six common test types, and most teams use the same vocabulary.
| Test type | What it answers | Load | Typical duration |
|---|---|---|---|
| Smoke test | Does the script work, and does the system respond under minimal load? | Very low | Seconds to minutes |
| Average-load test | Does the system meet its targets under normal production traffic? | Normal levels | 5–60 minutes |
| Stress test | What happens when traffic rises well above normal? | Above average | 5–60 minutes |
| Spike test | Can the system survive a sudden, short surge, such as a launch or a bot wave? | Very high, briefly | A few minutes |
| Soak test | Does performance degrade over hours, through memory leaks or growing queues? | Normal levels | Hours |
| Breakpoint test | At what load does the system stop meeting its targets? | Rising until failure | As long as needed |
Start with a smoke test to check the script, then run an average-load test. Stress, spike, soak and breakpoint tests come after the system passes the basics.
Turning traffic data into test targets
Test targets should come from data, not guesses. Here is how to derive them for a content site with 50 million page views a month.
- Average rate. 50,000,000 page views ÷ 30 days ÷ 86,400 seconds ≈ 19 page views per second.
- Peak rate. Traffic is uneven during the day. With a peak factor of 4, the busiest hour reaches about 77 page views per second.
- Requests per page. If each page view triggers 6 requests to your own servers after CDN caching, the origin sees about 460 requests per second at peak.
- Headroom. Add 50% for growth, campaigns and bots, which gives a target of about 700 requests per second.
- Concurrency. Little's Law says concurrent requests equal throughput multiplied by response time. At 700 requests per second and 0.3 seconds per request, the system handles about 210 requests at the same moment.
For a product with logged-in users, start from peak concurrent sessions and the actions each user performs per minute instead. Either way, write the assumptions down, so they can be checked against production data after launch.

How to plan and run a load test
- Define the questions. For example: can checkout handle 700 requests per second with a 95th percentile under 500 milliseconds and errors under 1%?
- Model the user journeys. Use real traffic logs to choose the mix: perhaps 60% browsing, 25% search, 10% account actions and 5% checkout. A test that hits only the home page tests the cache, not the system.
- Prepare the environment. Use production-like hardware, configuration and data volume. A database with 1,000 rows behaves very differently from one with 10 million.
- Prepare test data. Unique users, realistic search terms and enough products or records, so caches behave as they would with real traffic.
- Handle third parties. Payment providers, email services and external APIs usually forbid load tests against them. Replace them with stubs that respond with realistic delays.
- Ramp up gradually. Increase load in steps, hold each step for several minutes and record where response times start to bend upward.
- Watch the whole system. Monitor the servers, the database, caches, queues and the load generator itself. A load generator that runs out of CPU produces false results.
- Fix, then test again. Change one thing at a time, and repeat the same test so results are comparable.
- Keep the tests. Store scripts in the repository and run a short version regularly, for example before major releases, so performance regressions are caught early.
Metrics and thresholds that matter
| Metric | What it shows | Example threshold |
|---|---|---|
| Throughput | Requests or transactions handled per second | Meets the target rate |
| Response time, 95th percentile | The time within which 95% of requests complete | Under 500 ms for API calls |
| Response time, 99th percentile | The experience of the slowest 1% of requests | Under 1.5 seconds |
| Error rate | Share of failed requests, including timeouts | Under 1% |
| Saturation | CPU, memory, connection pools, queue length | No resource above about 80% at target load |
Averages hide problems. A system with an average response of 200 milliseconds can still make one user in twenty wait three seconds. The Google SRE book frames the same idea with its four golden signals of latency, traffic, errors and saturation, which map directly to the table above.
Load testing tools
| Tool | Scripts written in | Good for |
|---|---|---|
| k6 | JavaScript | Developer-friendly tests in CI, thresholds as code, cloud or local runs |
| Apache JMeter | GUI and XML | Teams that prefer a visual editor, many protocols |
| Gatling | Scala, Java or Kotlin | High load from one machine, detailed reports |
| Locust | Python | Python teams, flexible user behavior |
| wrk and oha | Command line | Quick checks of a single endpoint's raw throughput |
When choosing load testing tools for realistic enterprise traffic, look for ones that model mixed user journeys, ramp load in stages and report percentiles. For a quick check of one endpoint, a command-line tool is enough. For a release decision, use a scripted tool that models real journeys.
Launch or peak season coming? We plan and run load tests on realistic traffic, find the bottlenecks and fix them before your users notice.
Explore QA and DevOps servicesWhat load tests found in delivered projects
Cached fragments made a CMS three times faster
A US law firm runs several marketing websites on Verba, a custom content management system. Bots hitting pages that could not be cached pushed server load to its limit, and profiling showed that rendering the same header and footer on every request was the main bottleneck. A .wrk team cached these shared fragments and measured the effect with load tests run before and after the change using wrk and oha. Pages became about three times faster under load. Read the Verba CMS case study.
Targets set before building
For a telecom operator with peak loads above 12,000 inbound calls a day, the voice AI platform had to answer within two seconds and survive the failure of a node without downtime. The team designed a two-node cluster around those targets and tested automated failover before launch, then rolled out in stages: shadow mode, limited traffic and full production on two pilot sites. Read the on-premise voice AI case study.
Caching and hosting at media scale
The Daily Meal, a US food site with 30–50 million monthly page views and 1.7 million recipes, struggled with speed and uptime on customized hosting. .wrk moved it to managed hosting, added caching at the application and CDN levels and moved images to a dedicated server. The share of HTML responses delivered in 0.5 seconds or less rose to 80%, up from 50%. Read The Daily Meal case study.
Common load testing mistakes
- Testing a tiny database. Queries that are fast on test data slow down with production volumes.
- Hitting only cached pages. Tests that repeat the same URL measure the CDN, not the application.
- Reading averages. Percentiles and error rates show what users feel.
- Ignoring the load generator. An overloaded test machine looks like a slow server.
- Testing against third-party services. Use stubs, and check provider rate limits separately.
- Running it once. Performance changes with every release, so keep a short regular test.
- Testing without monitoring. A test that shows the system slowing down without showing why only starts the investigation.
Our guide to technical debt explains how performance problems fit into the wider cost of slow change, and our article on nearshore DevOps covers who usually owns this work.
Frequently asked questions
What is load testing?
Load testing sends realistic, controlled traffic to a system and measures response times, error rates and resource use as traffic grows. It shows whether the system meets its performance targets and where it starts to slow down or fail.
What is the difference between load testing and stress testing?
A load test checks behavior at expected traffic levels. A stress test pushes traffic well beyond normal levels to find how the system fails and whether it recovers. Both use the same tools with different load profiles.
How do you calculate the load for a load test?
Start from real traffic: average requests per second, a peak factor for the busiest hour, the number of requests each user action triggers and headroom for growth. Little's Law then gives concurrency: requests per second multiplied by response time in seconds.
What are the best load testing tools?
Common choices are k6, Apache JMeter, Gatling and Locust for scripted user journeys, and wrk or oha for quick single-endpoint checks. The best tool is one your team can script, run in CI and use to report percentiles and error rates.
How often should you run load tests?
Run a full load test before launches, major releases and expected peaks, and a shorter version regularly, for example weekly or before each release, so performance regressions are found early.
To sum up
Load testing tells you where your system breaks before your users find out. Derive targets from real traffic, model real user journeys, test against a production-like environment, judge results by percentiles and error rates, and keep the tests running after launch so regressions are caught as they appear.
.wrk helps companies in the US and Europe test and improve performance, with load test plans, tooling and the caching, database and infrastructure changes that raise capacity.
Not sure how much traffic your system can take? Share your traffic data and stack, and we will propose a load test plan with targets and a timeline.
Explore QA and DevOps services