The Daily Meal: SEO Dashboard Lifting Conversions by 9%
After five years of growth, The Daily Meal's releases occasionally introduced JavaScript errors and ad display issues that quietly dragged on Google rankings and conversions. We built an SEO and performance dashboard with daily and weekly email digests — conversion rate increased by 9%.
Client context
The Daily Meal is among the biggest food websites in the United States, attracting 30–50 million pageviews per month, 2.5 million unique users, and maintaining a library of 1.7 million recipes and 250 GB of images. After years of active development, releases began introducing minor regressions — JavaScript errors and ad display glitches — that, left undetected, could quickly affect Google's ranking and user numbers.
Challenge
The team had no systematic way to detect SEO regressions or performance degradations between releases. Issues affecting page quality, ad revenue, or user experience could compound before they were noticed. The site needed a monitoring and alerting layer that could surface problems in hours rather than weeks.
What we did
- Designed and built an internal dashboard tracking key SEO and performance metrics.
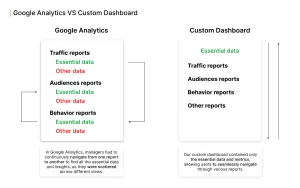
- Created graphical and tabular data visualisations giving editorial and technical teams an at-a-glance metric overview.
- Integrated predefined core metrics: pageviews, sessions, and conversions.
- Set up tracking for specific site sections: Home Page, Video Network, and Content Archive.
- Connected Google Analytics and internal event tracking as data sources.
- Implemented daily and weekly email newsletters with period-on-period performance comparisons sent automatically to stakeholders.
Process
- Metric definition workshops: aligned editorial, SEO, and engineering teams on the KPIs that matter most.
- Data pipeline design: connecting Google Analytics and internal tracking to the dashboard backend.
- Dashboard UI build: section-level views, trend charts, and tabular comparisons.
- Email digest system: templated daily and weekly reports with automated dispatch.
- QA against historical data; stakeholder review and sign-off.
- Ongoing dashboard maintenance and metric expansion as editorial needs evolved.
Result and impact
SEO ranking improved once regressions could be caught and fixed within a release cycle. Conversion rate rose by 9%. Stakeholders gained a shared, objective view of site health that previously required manual report compilation.